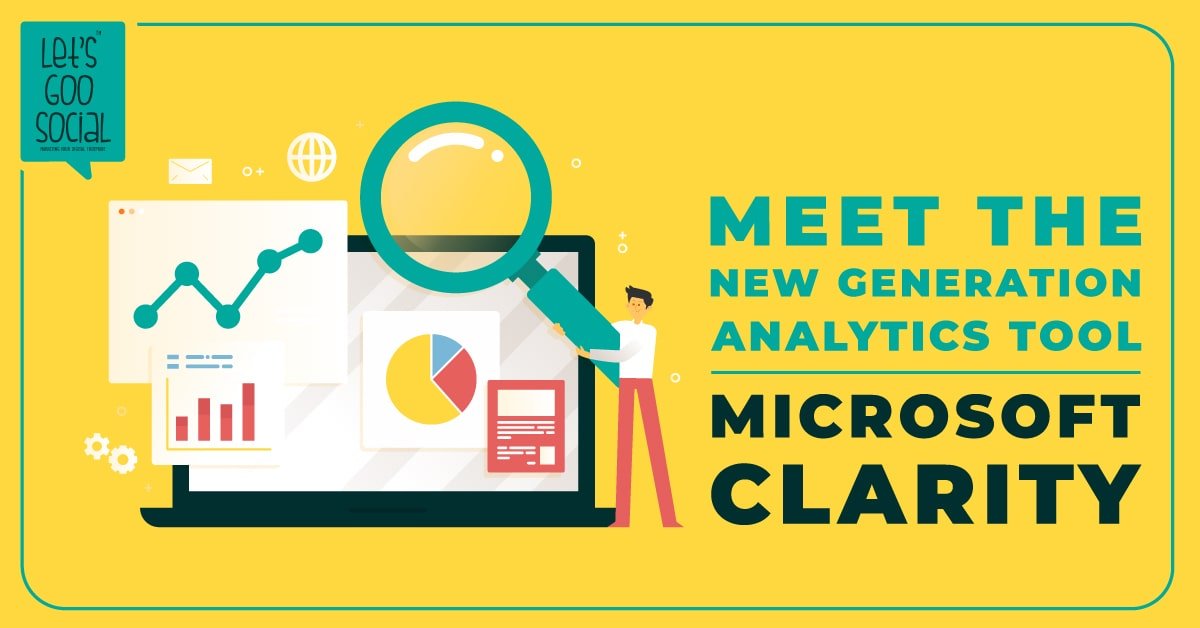
Microsoft Clarity is a free product to help site owners understand visitor behavior so that they can improve their user experiences which the company launched recently. It shows exactly what users are doing on your site while respecting their privacy. Microsoft Clarity is a free analytics tool that provides insights into how users are interacting with a site. Engagement metrics, website performance data and debugging information give an idea of how to improve web pages. Amazingly, there are no traffic caps. Even a site with a million visitors a day can use it. Additionally, it is said to be optimized to not slow sites down.
Compared to Google Analytics and other analytics platforms, it’s a little basic. But it’s robust, it’s easy to use, and it has some interesting features.
What are the key features of Microsoft Clarity?
- Dashboards & metrics – Clarity provides an extensive overview in the form of a dashboard. This contains all of the usual kinds of metrics you’d expect; session counts, total users, page view details, and similar. Surprisingly, the dashboard lacks some of the metrics you might expect in a tool like this. There’s no ‘bounce rate’, no ‘conversation rate’, and none of the kinds of tables you might be used to from tools like Google Analytics. You also can’t compare performance across multiple date ranges or segments.
- Clarity Heat Map – A heatmap is an analytics feature that shows where a site visitor clicked. This is helpful because it shows what page elements get clicked and can imply how far on a page most users get and hints at why. For example, if the majority of clicks happen nearer the top of the page than the bottom of the page then that means people are bailing and because of the heatmap you can understand why some of them leave the page. Clicks closer to the end of an article means a highly engaged reader. Clarity’s heatmap will feature an option for scrolling metrics in the near future too.
- Session recording – One of the great attractions of Clarity is that all sessions are recorded. Clarity logs the mouse movements, scrolling, and clicks of every visitor to the site. These can be viewed and replayed at any time in the future. Each of the dashboard panels provides shortcuts into these kinds of video recordings. You can drill down to see recordings from popular pages, from frustrated users, or from specific browsers.
In short it allows you to do the following:
- Designed to be easy to use on your website
- See what clicks with your users using heatmaps
- Align your expectations to observations with session playback
- Use the insights dashboard to view website performance
Clarity provides you with the tools to make informed decisions about changes to your website using real evidence and also it allows you to do so in a way that helps to respect your users’ privacy and data security. It’s clear that whilst there are some interesting metrics and reports, Clarity isn’t fully-featured enough to act as your primary website analytics tool. That’s especially true if you have a complex site with multiple goals, active marketing campaigns, and lots of moving parts.
If you require an in-depth plan based on website tools and analytics that can help your brand gain the right users and get access to various metrics, then we are here to help. At Let’s Goo Social, we know the importance and knowledge of website tools that can guarantee your success rate in the digital medium. Consult with our digital marketing team at IN: +91 9087706000 | SG: +65 8008526877 and gain access to real-time reporting and analysis to position your brand better and build more credibility.


